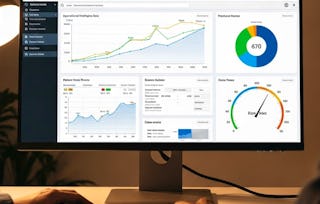
By the end of this course, learners will be able to analyze large datasets using Splunk’s statistical commands, transform raw events into meaningful metrics, build time-based and categorical visualizations, and correlate related events to uncover operational insights. Learners will also be able to apply conditional logic, enhance dashboards with advanced visualizations, and interpret trends and geographic patterns using Splunk.
This course provides a comprehensive, hands-on approach to mastering Splunk statistics and visualization techniques essential for data analysis, security monitoring, and operational intelligence. Through step-by-step lessons, learners explore core aggregation functions, charting and timechart commands, advanced visualizations such as gauges and cluster maps, and powerful transformation tools like eval and transaction commands.
Unlike introductory Splunk courses, this program uniquely combines statistical analysis, visualization best practices, and event correlation into a single, end-to-end learning journey. Learners gain practical skills directly applicable to real-world use cases such as KPI monitoring, trend analysis, and incident investigation. Upon completion, learners will be equipped to confidently design insightful dashboards, optimize searches, and extract actionable intelligence from Splunk data, making this course ideal for aspiring Splunk analysts, administrators, and data professionals.
This module introduces learners to Splunk’s statistical analysis capabilities by exploring the stats command and its core aggregation functions, enabling effective data summarization and insight extraction from large datasets.
涵盖的内容
6个视频4个作业
显示有关单元内容的信息
6个视频•总计50分钟
Stats Command•6分钟
Count Function in Stats•7分钟
Distinct Count Function in Stats•6分钟
Sum and Average Function in Stats•12分钟
Sum and Average Function in Stats Continues•10分钟
List and Value Function in Stats•9分钟
4个作业•总计60分钟
Introduction to Stats and Counting Techniques•10分钟
Distinct, Sum, and Average Calculations•10分钟
Advanced Aggregation Functions•10分钟
Graded-Mastering Statistical Analysis in Splunk•30分钟
Building Charts and Time-Based Visualizations
第 2 单元•小时 后完成
单元详情
This module focuses on transforming aggregated data into visual insights using Splunk’s chart and timechart commands, helping learners design effective visualizations for categorical and time-series analysis.
涵盖的内容
9个视频4个作业
显示有关单元内容的信息
9个视频•总计80分钟
Splunk Chart Command•10分钟
More on Chart in Splunk•10分钟
About Time Chart in Splunk•10分钟
Explain About Time Chart in Splunk Continues•7分钟
Splunk Charts Line Areak•10分钟
Line chart in Splunk Using Chart and Time Chart•9分钟
Area Chart in Splunk using Chart and Time Chart•9分钟
Bar Chart in Splunk•8分钟
Pie chart in Splunk•8分钟
4个作业•总计60分钟
Chart Command Fundamentals•10分钟
Deep Dive into Time-Based Charts•10分钟
Area, Bar, and Pie Visualizations•10分钟
Graded-Building Charts and Time-Based Visualizations•30分钟
Advanced Visualizations and Enhancements
第 3 单元•小时 后完成
单元详情
This module explores advanced visualization techniques in Splunk, including scatter plots, gauges, trend lines, totals, and geographical maps, to enhance analytical depth and dashboard effectiveness.
涵盖的内容
8个视频4个作业
显示有关单元内容的信息
8个视频•总计55分钟
Bubble and Scatter chart Visualizations in Splunk•8分钟
Single and Gauages type visualizations in Splunk•8分钟
Splunk Single Value Visualizations•6分钟
Add Totals and uses of Add Totals in Splunk•7分钟
Add Totals and uses of Add Totals in Splunk Continue•8分钟
Splunk Trend Line Command•5分钟
Cluster Map Visualization•7分钟
Cluster Map Visualization Continue•7分钟
4个作业•总计60分钟
Scatter, Bubble, and Gauge Visualizations•10分钟
Working with Totals and Trend Lines•10分钟
Geographical Visualizations with Cluster Maps•10分钟
Graded-Advanced Visualizations and Enhancements•30分钟
Data Transformation and Event Correlation
第 4 单元•小时 后完成
单元详情
This module covers advanced data transformation and event correlation techniques in Splunk, enabling learners to manipulate fields, apply conditional logic, and correlate related events for deeper operational insights.
涵盖的内容
10个视频4个作业
显示有关单元内容的信息
10个视频•总计88分钟
Splunk using Eval Command•11分钟
Splunk Stats Eval•5分钟
Splunk Tostring Function•7分钟
Splunk Tostring Function Continue•7分钟
Splunk if Function•7分钟
Splunk Filtering Results•11分钟
Splunk Transaction Command•9分钟
Splunk Transaction Command Continues•8分钟
Splunk Transaction Maxspan and Maxpause starts with Ends with•12分钟
Correlating Events•10分钟
4个作业•总计60分钟
Using Eval and Data Type Functions•10分钟
Conditional Logic and Result Filtering•10分钟
Transaction Analysis and Event Correlation•10分钟
Graded-Data Transformation and Event Correlation•30分钟
Welcome to EDUCBA, a place where knowledge is limitless! We provide a wide selection of instructive and engaging programmes designed to empower students of all ages and experiences. From the convenience of your home, start a revolutionary educational experience with our cutting-edge technologies courses and experienced instructors.
When will I have access to the lectures and assignments?
To access the course materials, assignments and to earn a Certificate, you will need to purchase the Certificate experience when you enroll in a course. You can try a Free Trial instead, or apply for Financial Aid. The course may offer 'Full Course, No Certificate' instead. This option lets you see all course materials, submit required assessments, and get a final grade. This also means that you will not be able to purchase a Certificate experience.
What will I get if I subscribe to this Specialization?
When you enroll in the course, you get access to all of the courses in the Specialization, and you earn a certificate when you complete the work. Your electronic Certificate will be added to your Accomplishments page - from there, you can print your Certificate or add it to your LinkedIn profile.
Is financial aid available?
Yes. In select learning programs, you can apply for financial aid or a scholarship if you can’t afford the enrollment fee. If fin aid or scholarship is available for your learning program selection, you’ll find a link to apply on the description page.