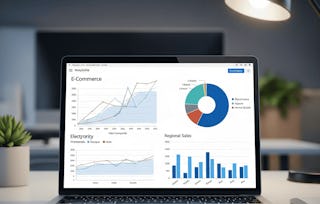
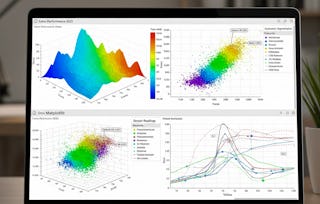
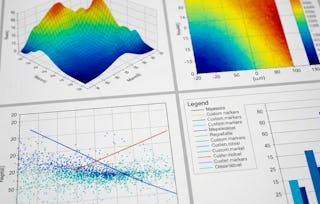
This comprehensive course equips learners with the skills to create, customize, and evaluate high-quality visualizations using Python’s Matplotlib library. Beginning with foundational plotting concepts, learners will identify key Matplotlib components, construct simple and multi-axis plots, and apply labeling, scaling, and annotation techniques to effectively convey data insights.
In the advanced modules, learners will design and differentiate specialized charts, including custom dashed lines, pseudocolor meshes, streamplots, ellipses, polar charts, and pie charts. They will manipulate figure styles, integrate image data, and modify axes properties to produce publication-ready visuals. By the end of the course, learners will be able to synthesize plotting techniques to create professional, context-specific visualizations that enhance data-driven storytelling.
This module introduces learners to the essential concepts and workflows of creating visualizations using Matplotlib. It covers the installation and setup of Python and Matplotlib, fundamental plotting commands, customization of simple plots, and managing figures and axes. Learners will develop the foundational skills necessary to create, modify, and interpret basic line graphs, preparing them for more advanced data visualization techniques.
涵盖的内容
12个视频4个作业
显示有关单元内容的信息
12个视频•总计90分钟
Introduction to Matplolip•10分钟
Simple Graphs•6分钟
Simple Graphs Continue•6分钟
More on Line Graphs•9分钟
Bar Graph•7分钟
Scatter Graph•8分钟
Using Text •11分钟
Annotation in Graph•5分钟
Basic of Pyplot•7分钟
Basic of Pyplot Tex•9分钟
Basic Barh and Fill•6分钟
Complex Fill Demo•7分钟
4个作业•总计60分钟
Getting Started with Matplotlib•10分钟
Working with Basic Plot Types•10分钟
Pyplot Essentials and Simple Enhancements•10分钟
Graded-Foundations of Matplotlib Visualization•30分钟
Advanced Plotting and Customization
第 2 单元•小时 后完成
单元详情
This module builds on foundational Matplotlib skills by exploring advanced chart types, specialized visuals, and customization techniques. Learners will work with complex plot elements such as custom line patterns, pseudocolor meshes, streamplots, ellipses, polar charts, and pie charts. They will also apply advanced styling to images, plots, and figure outputs using Matplotlib’s customization tools and style sheets, enabling them to produce visually refined, publication-ready visualizations.
Welcome to EDUCBA, a place where knowledge is limitless! We provide a wide selection of instructive and engaging programmes designed to empower students of all ages and experiences. From the convenience of your home, start a revolutionary educational experience with our cutting-edge technologies courses and experienced instructors.
When will I have access to the lectures and assignments?
To access the course materials, assignments and to earn a Certificate, you will need to purchase the Certificate experience when you enroll in a course. You can try a Free Trial instead, or apply for Financial Aid. The course may offer 'Full Course, No Certificate' instead. This option lets you see all course materials, submit required assessments, and get a final grade. This also means that you will not be able to purchase a Certificate experience.
What will I get if I subscribe to this Specialization?
When you enroll in the course, you get access to all of the courses in the Specialization, and you earn a certificate when you complete the work. Your electronic Certificate will be added to your Accomplishments page - from there, you can print your Certificate or add it to your LinkedIn profile.
Is financial aid available?
Yes. In select learning programs, you can apply for financial aid or a scholarship if you can’t afford the enrollment fee. If fin aid or scholarship is available for your learning program selection, you’ll find a link to apply on the description page.