This comprehensive course equips learners with the skills to create, customize, and evaluate high-quality visualizations using Python’s Matplotlib library. Beginning with foundational plotting concepts, learners will identify key Matplotlib components, construct simple and multi-axis plots, and apply labeling, scaling, and annotation techniques to effectively convey data insights.
Mastering Data Visualization with Matplotlib
您将学到什么
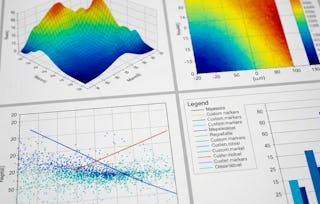
Construct simple and multi-axis plots with labels, scaling, and annotations.
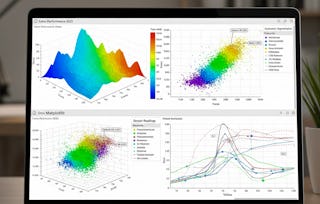
Design specialized charts including polar plots, streamplots, and pie charts.
Customize styles, axes, and figures to produce publication-ready visuals.
要了解的详细信息

可分享的证书
添加到您的领英档案
作业
8 项作业
授课语言:英语(English)
91%
of learners achieved a positive career outcome
了解顶级公司的员工如何掌握热门技能

积累特定领域的专业知识
本课程是 Matplotlib: Python Data Visualization & Wrangling 专项课程 专项课程的一部分
在注册此课程时,您还会同时注册此专项课程。
- 向行业专家学习新概念
- 获得对主题或工具的基础理解
- 通过实践项目培养工作相关技能
- 获得可共享的职业证书

从 Data Analysis 浏览更多内容
人们为什么选择 Coursera 来帮助自己实现职业发展

Felipe M.
自 2018开始学习的学生
''能够按照自己的速度和节奏学习课程是一次很棒的经历。只要符合自己的时间表和心情,我就可以学习。'

Jennifer J.
自 2020开始学习的学生
''我直接将从课程中学到的概念和技能应用到一个令人兴奋的新工作项目中。'

Larry W.
自 2021开始学习的学生
''如果我的大学不提供我需要的主题课程,Coursera 便是最好的去处之一。'

Chaitanya A.
''学习不仅仅是在工作中做的更好:它远不止于此。Coursera 让我无限制地学习。'
学生评论
- 5 stars
43.75%
- 4 stars
50%
- 3 stars
0%
- 2 stars
0%
- 1 star
6.25%
显示 3/16 个
NN
已于 Jan 8, 2026审阅
Nice mix of simple and complex plots. I’d recommend this if you want practical knowledge rather than theoretical depth.
JV
已于 Dec 26, 2025审阅
Some advanced styling concepts may require extra practice, but they are explained well enough to follow along.
JI
已于 Jan 18, 2026审阅
While the basics are covered well, a few advanced customization concepts could use more detailed explanation.
通过在线学位推动您的职业生涯
获取世界一流大学的学位 - 100% 在线


