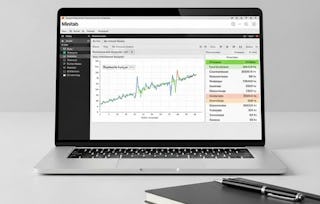
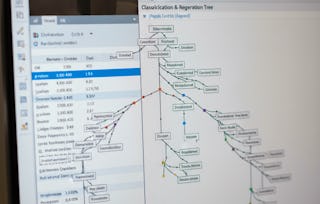
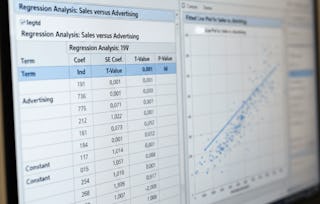
By the end of this course, learners will be able to apply advanced regression techniques, interpret outputs, diagnose model issues, and implement logistic regression for real-world business applications. They will also master statistical tools in Excel and Minitab, enabling them to perform t-tests, ANOVA, correlation, and predictive modeling with confidence.
This course equips learners with both theoretical understanding and hands-on practice in predictive analytics. Through practical datasets, scatterplots, and business-focused case studies, learners will gain the ability to transform raw data into actionable insights. They will develop critical skills in identifying predictor significance, handling multicollinearity, and generating accurate regression equations.
What makes this course unique is its balance of applied examples, rigorous diagnostics, and practical tool demonstrations. From consumer purchase analysis to business decision-making scenarios, learners will see how regression techniques directly support strategic outcomes. By completing this course, learners will be prepared to evaluate data-driven models, interpret complex statistical outputs, and apply regression analysis to solve real-world challenges.
This module introduces learners to advanced regression methods, focusing on predicted values, scatterplots, regression outputs, and diagnostics. Learners will gain practical skills in interpreting coefficients, testing significance, and identifying issues such as multicollinearity to ensure robust regression modeling.
涵盖的内容
11个视频3个作业
显示有关单元内容的信息
11个视频•总计93分钟
Generate Predicted Values•8分钟
Scatterplot Return RIL•7分钟
Basic Multiple Regression•9分钟
Basic Multiple Regression Continues•8分钟
Basic Multiple Regression - Interpretation•5分钟
Generate Basic Statistics•7分钟
Working on Scatterplot•4分钟
Dependent Variable Objective•12分钟
Concept of Multicollinearity•9分钟
Identify Dependent Variable Y•12分钟
Outputs and Observation•12分钟
3个作业•总计50分钟
Predicted Values & Scatterplots•10分钟
Regression Outputs and Diagnostics•10分钟
Advanced Regression Techniques•30分钟
Interpreting Regression Results
第 2 单元•小时 后完成
单元详情
This module emphasizes applied examples of regression, guiding learners through practical dataset analysis and interpretation. Learners will practice predicting values, visualizing results, and comparing models to develop strong data-driven decision-making skills.
涵盖的内容
11个视频3个作业
显示有关单元内容的信息
11个视频•总计89分钟
Interpretations - Example 3•10分钟
Calculate with and without Flux•7分钟
Scatterplot of Heart FLux Vs Insolation•6分钟
Interpretation of Datasets•12分钟
Implementation of Datasets•7分钟
Example 4 Observations•10分钟
Display Descriptive Statistics•7分钟
Predicted Values Example 4•10分钟
Scatterplot of Example 4•5分钟
Calculating IV - Multiple Regression•10分钟
Calculating Independent Multiple Regression•4分钟
3个作业•总计50分钟
Applied Examples in Regression•10分钟
Predicted Values and Scatterplots•10分钟
Interpreting Regression Results•30分钟
Logistic Regression & Applications
第 3 单元•小时 后完成
单元详情
This module explores logistic regression foundations and real-world applications. Learners will understand categorical outcomes, interpret odds ratios, generate logistic models, and apply business-relevant case studies for actionable insights.
涵盖的内容
16个视频3个作业
显示有关单元内容的信息
16个视频•总计144分钟
Understanding Basic Logistic Scatter Plot•10分钟
Basic Logistic Scatter Plot Continues•8分钟
Generation of Regression Equation•11分钟
Tabulated Values•7分钟
Interpretation and Implementation on Dataset•11分钟
Interpretation and Implementation on Dataset Continues•8分钟
Output and Observation - Tabulated Values•9分钟
Business Metrics Example•7分钟
Example Two and Three Interpretations•7分钟
Regression Equation Group•8分钟
Interpretation and Implementation of Scatter Plot•9分钟
More on Implementation of Scatter Plot•6分钟
Plastic Case Strength•11分钟
Separate Equations•11分钟
Generation of Predicted Values•11分钟
Scatter Plot Strength Vs Temp•10分钟
3个作业•总计50分钟
Logistic Regression Foundations•10分钟
Outputs and Case Studies•10分钟
Logistic Regression & Applications•30分钟
Business Applications & Data Analysis Tools
第 4 单元•小时 后完成
单元详情
This module focuses on applying regression and statistical tools to real-world business and consumer data. Learners will use Excel and Minitab for analysis, implement tests like t-test, ANOVA, and correlation, and generate actionable insights for business applications.
Welcome to EDUCBA, a place where knowledge is limitless! We provide a wide selection of instructive and engaging programmes designed to empower students of all ages and experiences. From the convenience of your home, start a revolutionary educational experience with our cutting-edge technologies courses and experienced instructors.
When will I have access to the lectures and assignments?
To access the course materials, assignments and to earn a Certificate, you will need to purchase the Certificate experience when you enroll in a course. You can try a Free Trial instead, or apply for Financial Aid. The course may offer 'Full Course, No Certificate' instead. This option lets you see all course materials, submit required assessments, and get a final grade. This also means that you will not be able to purchase a Certificate experience.
What will I get if I subscribe to this Specialization?
When you enroll in the course, you get access to all of the courses in the Specialization, and you earn a certificate when you complete the work. Your electronic Certificate will be added to your Accomplishments page - from there, you can print your Certificate or add it to your LinkedIn profile.
Is financial aid available?
Yes. In select learning programs, you can apply for financial aid or a scholarship if you can’t afford the enrollment fee. If fin aid or scholarship is available for your learning program selection, you’ll find a link to apply on the description page.