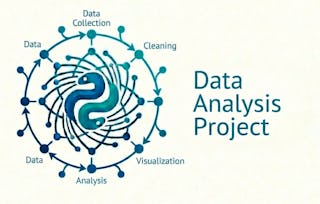
This course is the sixth of eight courses. This project provides an in-depth exploration of key Data Science concepts focusing on algorithm design. It enhances essential mathematics, statistics, and programming skills required for common data analysis tasks. You will engage in a variety of mathematical and programming exercises while completing a data clustering project using the K-means algorithm on a provided dataset.
This week, we will delve into the core concepts of mean, variance, and other basic statistics, laying the groundwork for a solid understanding of data analysis principles. Through hands-on exercises and demonstrations in Python and Jupyter notebooks, we'll explore practical techniques for calculating and interpreting statistical measures.
涵盖的内容
10个视频7篇阅读材料10个作业1次同伴评审1个非评分实验室
显示有关单元内容的信息
10个视频•总计38分钟
Introduction to this course in the specialisation•2分钟
Introduction to Mathematical Concepts of Data Clustering•2分钟
Mean of One Dimensional Lists•2分钟
Variance and Standard Deviation•4分钟
Jupyter Notebooks•6分钟
Variables•4分钟
Lists•5分钟
Computing the Mean•3分钟
Better Lists: NumPy•4分钟
Computing the Standard Deviation•6分钟
7篇阅读材料•总计75分钟
Course Syllabus•10分钟
Getting ready for this course•10分钟
Population vs Sample, Bias•10分钟
Variability, Standard Deviation and Bias•10分钟
How to back-up your virtual lab work•5分钟
Python Style Guide•10分钟
Numpy and Array Creation•20分钟
10个作业•总计84分钟
Week 1 Summative Assessment•40分钟
Population vs Sample – Review Information
•10分钟
Mean of One-Dimensional Lists – Review Information•3分钟
Variance and Standard Deviation – Review Information•3分钟
Jupyter Notebooks – Review Information•5分钟
Variables – Review Information
•5分钟
Lists – Review Information
•5分钟
Computing the Mean – Review Information•3分钟
Better Lists – Review Information
•5分钟
Computing the Standard Deviation – Review Information•5分钟
1次同伴评审•总计30分钟
Use Jupyter Notebooks•30分钟
1个非评分实验室•总计15分钟
Jupyter Notebook Environment•15分钟
Week 2: Moving from One to Two Dimensional Data
第 2 单元•小时 后完成
单元详情
This week, we will explore mathematics for multidimensional data. You will also learn how to work with multidimensional data in Python.
涵盖的内容
14个视频10篇阅读材料14个作业
显示有关单元内容的信息
14个视频•总计52分钟
Multidimensional Data Points and Features•2分钟
Multidimensional Mean•3分钟
Dispersion: Multidimensional Variables•3分钟
Distance Metrics•5分钟
Normalisation•1分钟
Outliers•1分钟
Basic Plotting•3分钟
Storing 2D Coordinates in a Single Data Structure•6分钟
Multidimensional Mean•5分钟
Adding Graphical Overlays•6分钟
Calculating the Distance to the Mean•4分钟
List Comprehension•4分钟
Normalisation in Python•6分钟
Outliers and Plotting Normalised Data•3分钟
10篇阅读材料•总计120分钟
Multidimensional Data Points and Features Recap•10分钟
Multidimensional Mean Recap•10分钟
Multidimensional Variables Recap•10分钟
Distance Metrics Recap•10分钟
Normalisation Recap•10分钟
Note on Matplotlib•10分钟
Matplotlib Scatter Plot Documentation•20分钟
Matplotlib Patches Documentation•10分钟
List Comprehension Documentation•20分钟
Errata•10分钟
14个作业•总计110分钟
Week 2 Summative Assessment•40分钟
Multidimensional Data Points and Features – Review Information•3分钟
Week 3: Introducing Pandas and Using K-Means to Analyse Data
第 3 单元•小时 后完成
单元详情
This week, we will explore data manipulation and visualisation with Python's Pandas library. We will dive deep into the versatile capabilities of Pandas, empowering you to efficiently manipulate, analyse, and interpret data.
涵盖的内容
6个视频6篇阅读材料7个作业1次同伴评审
显示有关单元内容的信息
6个视频•总计36分钟
Using the Pandas Library to Read csv Files•5分钟
Sorting and Filtering Data Using Pandas•8分钟
Labelling Points on a Graph•4分钟
Labelling all the Points on a Graph•3分钟
Eyeballing the Data•6分钟
Using K-Means to Interpret the Data•9分钟
6篇阅读材料•总计60分钟
Code Resources•5分钟
Pandas Read_CSV Function•15分钟
More Pandas Library Documentation•10分钟
The Pyplot Text Function•10分钟
For Loops in Python•10分钟
Documentation for sklearn.cluster.KMeans•10分钟
7个作业•总计68分钟
Week 3 Summative Assessment•40分钟
Using the Pandas Library to Read csv Files – Review Information•5分钟
Sorting and Filtering Data Using Pandas – Review Information•5分钟
Labelling Points on a Graph – Review Information•5分钟
Labelling all the Points on a Graph – Review Information•5分钟
Eyeballing the Data – Review Information•5分钟
Using K-Means to Interpret the Data – Review Information•3分钟
1次同伴评审•总计60分钟
Create a Labelled Plot of the Happiness Data•60分钟
Week 4: A Data Clustering Project
第 4 单元•小时 后完成
单元详情
This week, we will embark on a journey through the fascinating world of unsupervised learning, where patterns emerge from data without explicit guidance. You will implement the K-means algorithm to solve a real-world problem.
涵盖的内容
8个视频3篇阅读材料3个作业3次同伴评审5个讨论话题
显示有关单元内容的信息
8个视频•总计28分钟
Can a Machine Detect Fake Notes?•2分钟
Working for a Client•5分钟
How to Organize Work on Your Project•4分钟
Dealing With Difficulties•3分钟
No Data no Data Science: Introduction of the Dataset•5分钟
Modelling•5分钟
Presenting the Project Results•3分钟
End of course•1分钟
3篇阅读材料•总计25分钟
Week 4 Code Resource – the Dataset for our Project•10分钟
Saving plt.scatter Outputs as Figures•10分钟
Additional Recommended Reading for Week 4•5分钟
3个作业•总计22分钟
Week 4 Summative Assessment
•15分钟
How Would You Help? – Review Information•2分钟
Python – Review Information•5分钟
3次同伴评审•总计180分钟
Exploratory Data Analysis•60分钟
Clustering•60分钟
Your Report•60分钟
5个讨论话题•总计70分钟
What Is Required to Train a Machine to Detect Fake Notes?•10分钟
The University of London is a federal University which includes 17 world leading Colleges. With extensive experience in distance learning since 1858, University of London has enriched the lives of thousands of students, delivering high quality degrees across the globe. Today, University of London is a global leader in flexible study, offering degree programmes to over 45,000 students in over 190 countries, delivering world-leading research across the world. To find out more about University of London, visit www.london.ac.uk
At IBM, we know how rapidly tech evolves and recognize the crucial need for businesses and professionals to build job-ready, hands-on skills quickly. As a market-leading tech innovator, we’re committed to helping you thrive in this dynamic landscape. Through IBM Skills Network, our expertly designed training programs in AI, software development, cybersecurity, data science, business management, and more, provide the essential skills you need to secure your first job, advance your career, or drive business success. Whether you’re upskilling yourself or your team, our courses, Specializations, and Professional Certificates build the technical expertise that ensures you, and your organization, excel in a competitive world.
When will I have access to the lectures and assignments?
To access the course materials, assignments and to earn a Certificate, you will need to purchase the Certificate experience when you enroll in a course. You can try a Free Trial instead, or apply for Financial Aid. The course may offer 'Full Course, No Certificate' instead. This option lets you see all course materials, submit required assessments, and get a final grade. This also means that you will not be able to purchase a Certificate experience.
What will I get if I subscribe to this Specialization?
When you enroll in the course, you get access to all of the courses in the Specialization, and you earn a certificate when you complete the work. Your electronic Certificate will be added to your Accomplishments page - from there, you can print your Certificate or add it to your LinkedIn profile.
Is financial aid available?
Yes. In select learning programs, you can apply for financial aid or a scholarship if you can’t afford the enrollment fee. If fin aid or scholarship is available for your learning program selection, you’ll find a link to apply on the description page.