In today’s data-driven world, making sense of your sales data is essential for staying competitive. This Guided Project was created to help aspiring data analysts and business professionals build a comprehensive sales dashboard in Power BI, providing them with the skills to explore and visualize data like a pro.
PowerBI for Beginners: Sales Data Exploration
您将学到什么
Explore your data in Power BI by following a structured data exploration roadmap, from data loading to visualization and insight.
Analyze sales, profit, and customer data using Power BI to identify key business insights and trends.
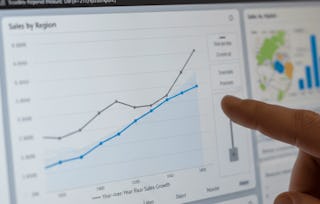
Create interactive data visualizations, including line charts, bar charts, pie charts, and tree maps, to effectively present sales and location data.
您将练习的技能
要了解的详细信息

可分享的证书
添加到您的领英档案
授课语言:英语(English)
无需下载或安装
仅桌面可用
91% of learners achieved a positive career outcome
了解顶级公司的员工如何掌握热门技能

在 2 小时内学习、练习并应用岗位必备技能
- 接受行业专家的培训
- 获得解决实训工作任务的实践经验
- 使用最新的工具和技术来建立信心

关于此指导项目
分步进行学习
在与您的工作区一起在分屏中播放的视频中,您的授课教师将指导您完成每个步骤:
Load and Transform Your Data
Analyze Sales Trends Over Time
Visualize Product Sales Insights
Identify Key Customer Segments
Explore Regional Sales Performance
推荐体验
Basic computer skills (navigating files, using software). Familiarity with Excel and understanding of spreadsheets, rows, and columns.
5个项目图片
位教师

24 门课程89,626 名学生
提供方
学习方式
基于技能的实践学习
通过完成与工作相关的任务来练习新技能。
专家指导
使用独特的并排界面,按照预先录制的专家视频操作。
无需下载或安装
在预配置的云工作空间中访问所需的工具和资源。
仅在台式计算机上可用
此指导项目专为具有可靠互联网连接的笔记本电脑或台式计算机而设计,而不是移动设备。
人们为什么选择 Coursera 来帮助自己实现职业发展

Felipe M.
自 2018开始学习的学生
''能够按照自己的速度和节奏学习课程是一次很棒的经历。只要符合自己的时间表和心情,我就可以学习。'

Jennifer J.
自 2020开始学习的学生
''我直接将从课程中学到的概念和技能应用到一个令人兴奋的新工作项目中。'

Larry W.
自 2021开始学习的学生
''如果我的大学不提供我需要的主题课程,Coursera 便是最好的去处之一。'

Chaitanya A.
''学习不仅仅是在工作中做的更好:它远不止于此。Coursera 让我无限制地学习。'
学生评论
- 5 stars
82.92%
- 4 stars
12.19%
- 3 stars
2.43%
- 2 stars
0%
- 1 star
2.43%
显示 3/41 个
JM
已于 Apr 17, 2025审阅
Great for beginners. It walks you through the process step by step. Most of it was watching a video and following along. I was hoping for something more challenging.