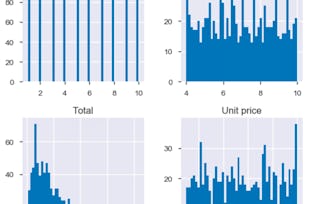
Learners will develop the ability to explore, visualize, and interpret data using R, ggplot2, and linear analysis techniques to generate meaningful insights. By the end of this course, learners will confidently apply exploratory data analysis (EDA) methods to understand data structure, identify patterns, visualize relationships, and evaluate linear trends.
This project-based course guides learners through a complete EDA workflow, starting from understanding datasets and variable types to creating professional-quality visualizations using the grammar of graphics. Learners will analyze univariate and bivariate data, customize plots for clarity, detect outliers, and visually assess linear relationships using regression techniques. Each concept is reinforced through hands-on practice with real-world data scenarios.
What makes this course unique is its strong emphasis on practical visualization-driven analysis, not just theory. Learners gain experience producing production-ready plots and interpreting analytical results in a way that supports data-driven decision-making. This course is ideal for aspiring data analysts and professionals who want to strengthen their EDA, data visualization, and analytical storytelling skills using R.
This module introduces learners to the core principles of Exploratory Data Analysis using R and ggplot2. Learners explore dataset structure, variable types, and initial data inspection techniques, and then apply the grammar of graphics to create meaningful visualizations that support data-driven insights.
涵盖的内容
10个视频4个作业
显示有关单元内容的信息
10个视频•总计71分钟
Project Overview: EDA with ggplot2•2分钟
Understanding the Dataset for EDA•7分钟
Data Structure and Variable Types•8分钟
Initial Data Exploration Techniques Part 1•7分钟
Initial Data Exploration Techniques Part 2•8分钟
Introduction to ggplot2 Grammar•8分钟
Basic Plots Using ggplot2•8分钟
Aesthetics and Mappings in ggplot2•8分钟
Geometric Objects and Layers•9分钟
Faceting and Grouped Visualizations•6分钟
4个作业•总计60分钟
Graded-Foundations of Exploratory Data Analysis with ggplot2•30分钟
Getting Started with EDA•10分钟
Exploring Data Before Visualization•10分钟
Building Visualizations with ggplot2•10分钟
Advanced Visualization and Linear Relationships
第 2 单元•小时 后完成
单元详情
This module focuses on enhancing visual analysis and uncovering relationships within data using advanced ggplot2 techniques. Learners analyze univariate and bivariate distributions, identify patterns and trends, visualize linear relationships, interpret regression results, and synthesize insights for effective communication.
涵盖的内容
9个视频4个作业
显示有关单元内容的信息
9个视频•总计63分钟
Customizing Plots and Themes•10分钟
Univariate Data Analysis•5分钟
Bivariate Analysis Using Plots•8分钟
Identifying Patterns and Trends•8分钟
Introduction to Linear Relationships•5分钟
Visualizing Linear Regression•8分钟
Interpreting Regression Plots•9分钟
Outliers and Influential Points•6分钟
Final Insights and EDA Summary•5分钟
4个作业•总计60分钟
Graded-Advanced Visualization and Linear Relationships•30分钟
Welcome to EDUCBA, a place where knowledge is limitless! We provide a wide selection of instructive and engaging programmes designed to empower students of all ages and experiences. From the convenience of your home, start a revolutionary educational experience with our cutting-edge technologies courses and experienced instructors.
When will I have access to the lectures and assignments?
To access the course materials, assignments and to earn a Certificate, you will need to purchase the Certificate experience when you enroll in a course. You can try a Free Trial instead, or apply for Financial Aid. The course may offer 'Full Course, No Certificate' instead. This option lets you see all course materials, submit required assessments, and get a final grade. This also means that you will not be able to purchase a Certificate experience.
What will I get if I subscribe to this Specialization?
When you enroll in the course, you get access to all of the courses in the Specialization, and you earn a certificate when you complete the work. Your electronic Certificate will be added to your Accomplishments page - from there, you can print your Certificate or add it to your LinkedIn profile.
Is financial aid available?
Yes. In select learning programs, you can apply for financial aid or a scholarship if you can’t afford the enrollment fee. If fin aid or scholarship is available for your learning program selection, you’ll find a link to apply on the description page.